Edit chart
Loading graph
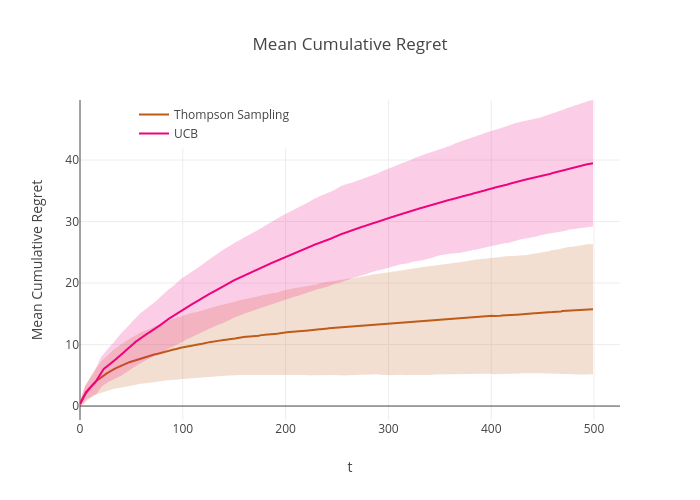
Aw1_mailinator's interactive graph and data of "Mean Cumulative Regret" is a filled line chart, showing Thompson Sampling, Thompson Sampling, UCB, UCB; with t in the x-axis and Mean Cumulative Regret in the y-axis.. The x-axis shows values from 0 to 525.2631578947369. The y-axis shows values from -2.2674717048559794 to 49.76494633876534.